Building a basic JNDI/JDBC report
To build a report you need to create a file called: reports/<reportid>/reportconf.yaml . Where <reportId> is an unique identifier for your reports. Before you continue you will have to ensure you have setup users.
For this report, we are going give it the report id: TheAnswers. Create a file called:
reports/TheAnswers/reportconf.yaml
Data source selection
Then you need to choose your data type. For the moment I would recommend JDBC if you you haven't set the
If you are creating a JNDI report add the following code to reports/TheAnswers/reportconf.yaml:
type: "JNDI"
jndi: "dataSource"
Where "dataSource" is your JNDI. Make sure you install the JNDI into your container correctly before continuing.
If you are using a JDBC add the following code to reports/TheAnswers/reportconf.yaml:
type: "JDBC"
classLoaderPath: "com.mysql.jdbc.Driver"
jdbc: "jdbc:mysql://localhost:3306/test"
username: "test"
password: "test"
Substitute the values as required. (Usernames / passwords / data source. )
Query construction
Next thing to do is to create the Query, put the following code in:
sql: "SELECT id, question, answer FROM Answers <@limit />"
And import the following GIST into your database:
https://gist.github.com/arranubels/8413731
This should be enough for a basic report.
Setting up the user to access the report
Ensure you have setup the user to be able to access the report. If you are using the File Authentication Provider you can follow the instructions below.
File Authentication Provider
To allow the report to be accessed ensure that the 2 files exist, in the reports/ directory,
- users.yaml
- groups.yaml
With the contents: (You may have more in there.)
users.yaml
- { username: "testuser", password: "t3st", groups: ["group1"] }
groups.yaml
- { groupname: "group1", reports: [ "TheAnswers" ] }
This creates a group called "group1" which can access the report "TheAnswers" and creates a user called "testuser." Obviously in a real system you would want this data to at least be encrypted.
Viewing the report
Follow the instructions in the Getting Started guide to bring up the server in your chosen method.
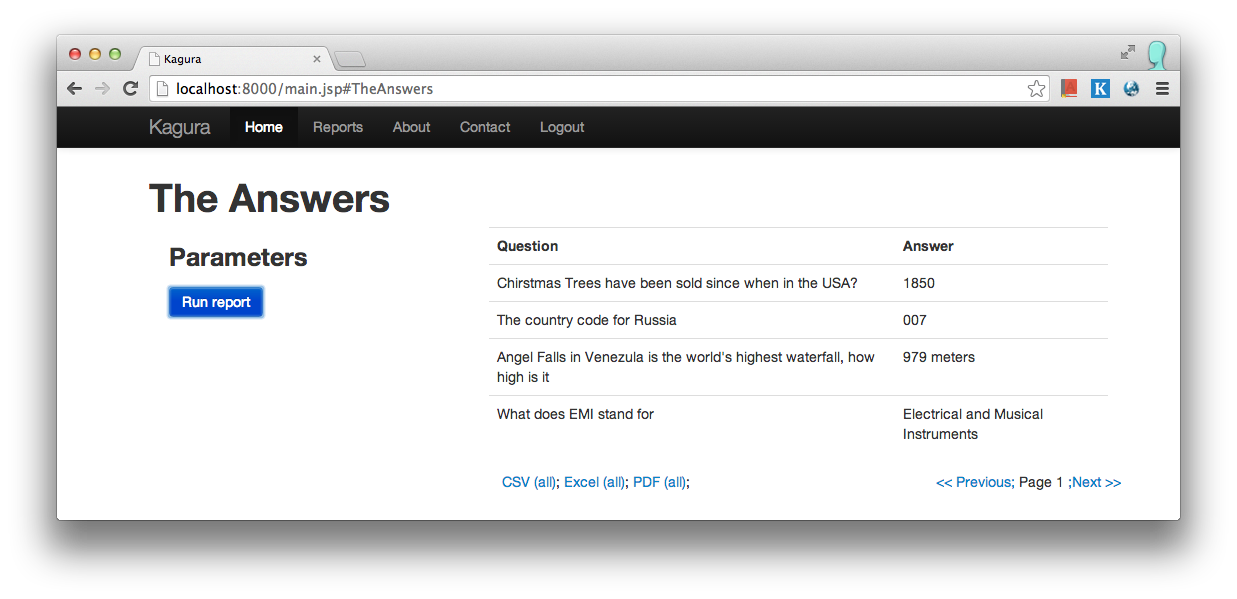
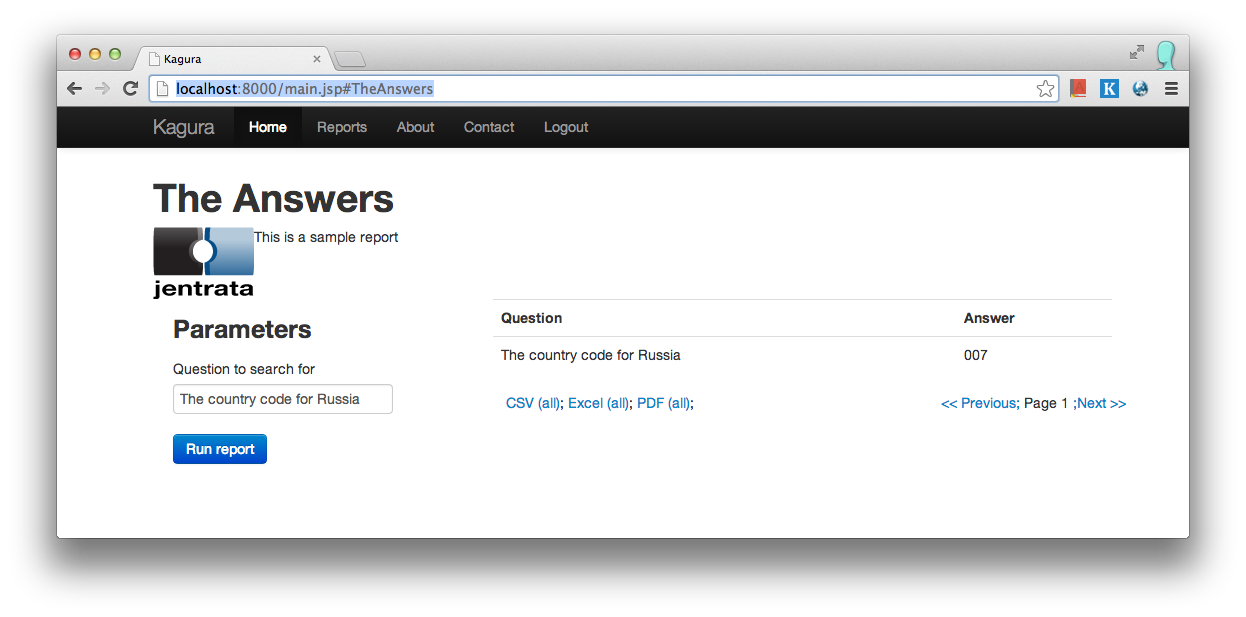
When you visit the report it should look like this:
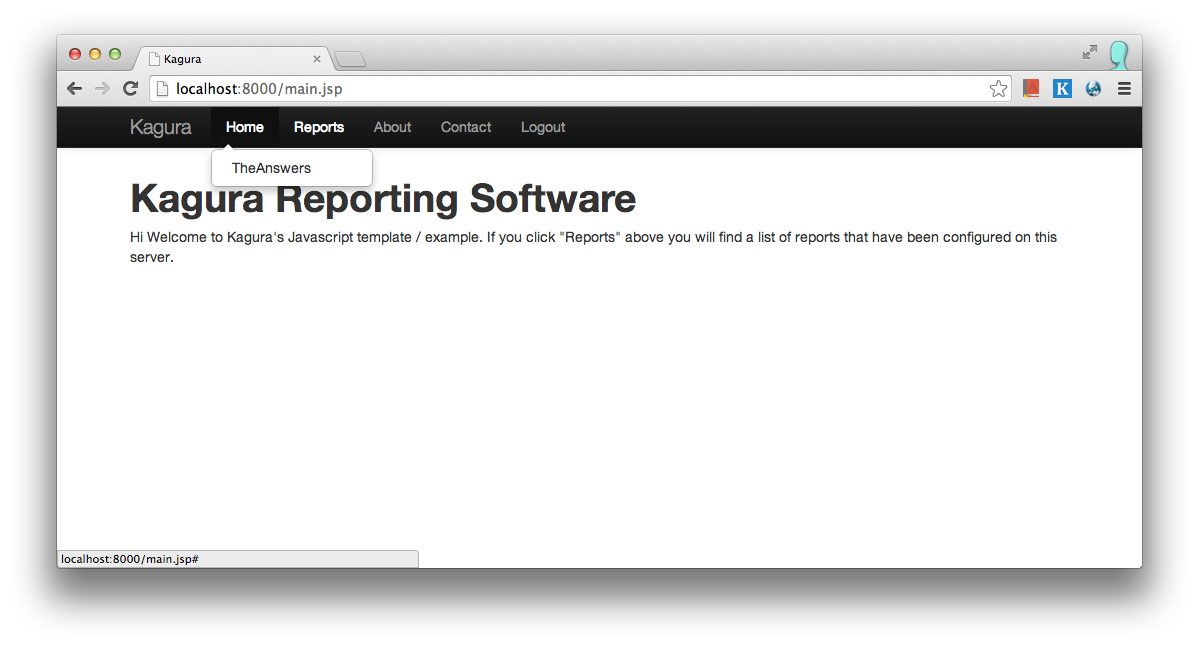
There are a couple things to note:
- The column headers need to be improved.
- The id column is visible
- The name is "TheAnswers" wouldn't we want that to be "The Answers"
- Maybe we would like a description
- The report runs immediately after opening the page
- No filtering parameters
These will be addressed in the next sections.
Customising Columns
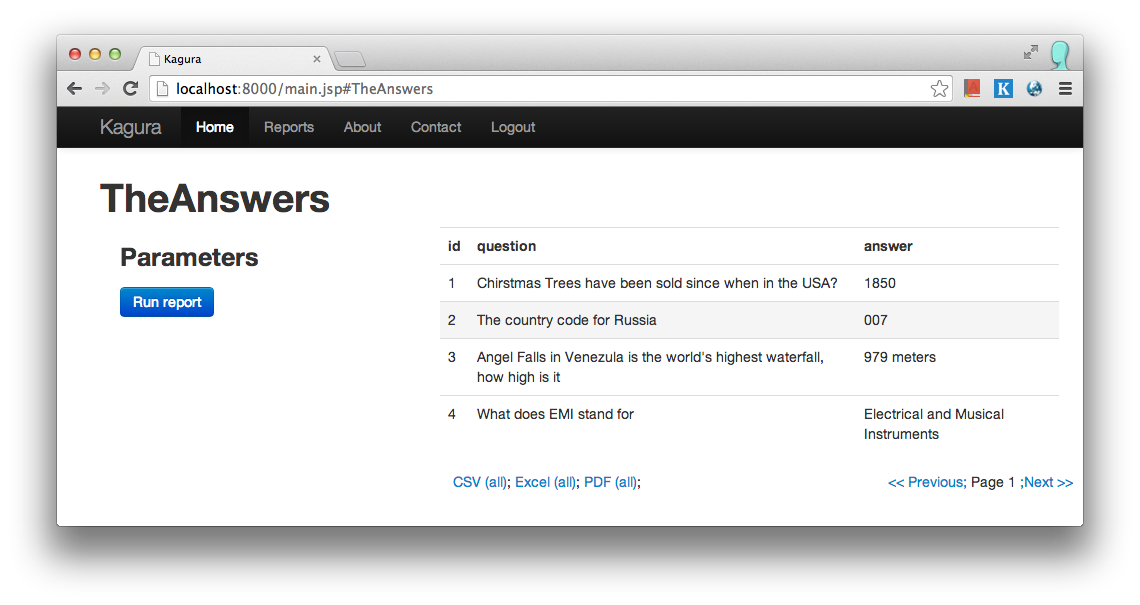
You can customise columns. However note, customising columns is all or nothing. If you specify that some columns exist, Kagura will only return those columns, for instance, we want to get rid of "id" we will have to specify all other columns. We would do that by adding:
columns:
  - name: question
  - name: answer
If you have a look now. Only 2 columns are shown, however if we try change the name or case. It causes the columns to loose their content:
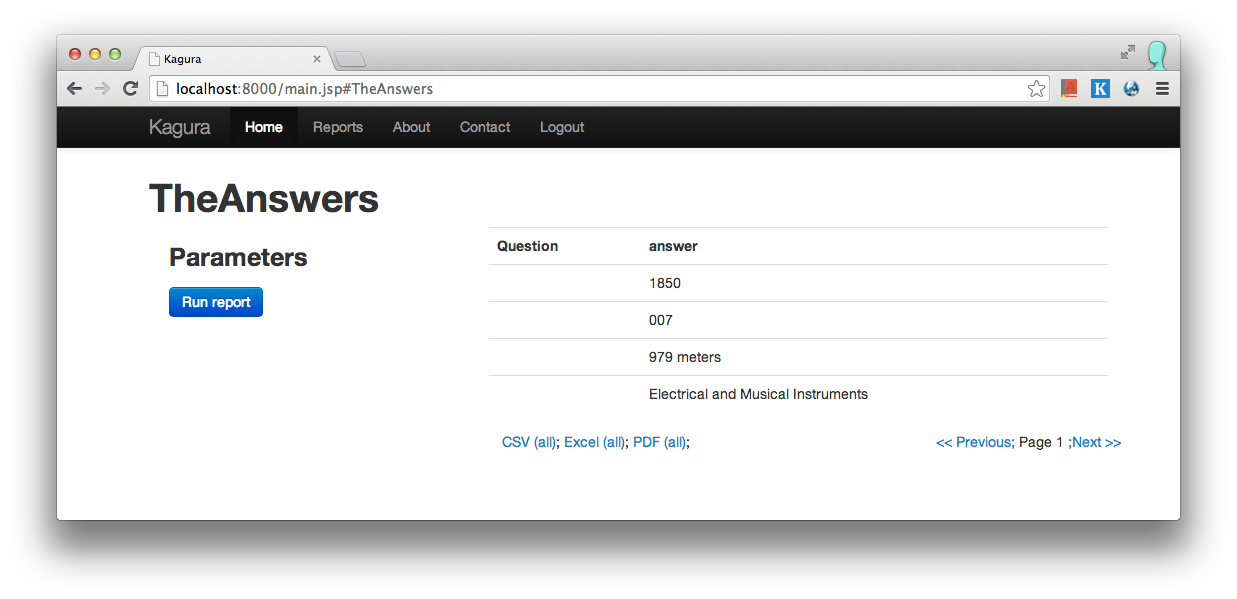
How do we get around this. Simple, we add a value called "label" like so:
columns:
  - name: question
    label: Question
  - name: answer
    label: Answer
Or
columns:
  - { name: question, label: Question }
  - { name: answer, label: Answer }
This effectively maps the column named "question" to a display column named "Question":
If you have customised the front end, you can also pass columns something called "extraOptions" these are passed straight though the REST service and allows you to pass extra details such as style information, or extra rending info. An example of that could be:
columns:
  - name: test1
    extraOptions:
      styleType: text
  - name: test2
    extraOptions:
      styleType: numbers
or
columns:
  - { name: test1, extraOptions: { styleType: text } }
  - { name: test2, extraOptions: { styleType: numbers } }
From there Kagura.js can handle these options anyway it chooses.
Extra Options
The "extraOptions" tag doesn't just exist for columns, it exists for the whole report too. Using this we can do things such as:
- Set the report name to be different from the report id
- Show a description or a picture / banner with the report
- Prevent the front end from immediately rendering the report
- Create sub directories for reports
- Allows for future customisations
For a more comprehensive guide, checkout the Kagura.js documentation.
Report name
Let's say for instance we want to change the report name, we could do so simply by adding:
extraOptions:
  reportName: "The Answers"
Done.
Description and Icon
You can also add a description and a
extraOptions:
  reportName: "The Answers"
  description: "This is a sample report"
  image: "http://jentrata.org/images/jentrata.png"
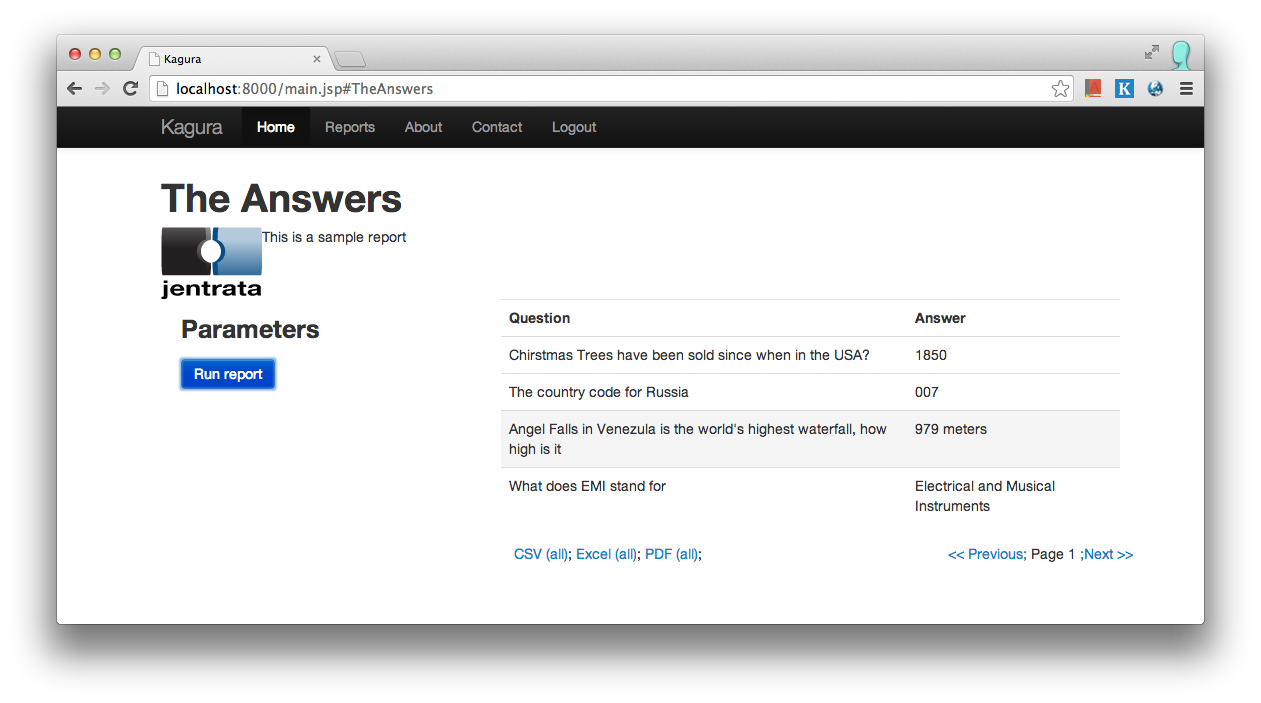
Obviously the image layout and configuration of how these are interpreted should be modified by the the end project. The front end is provided as an example and a starting point.
Preventing the report from auto-loading results
Sometimes you have a report that takes too long to load, you can turn that off by setting the following parameter:
extraOptions:
  autorun: no
Also, if you hot-link a report, it will not auto run and you will be required to press the "Run Report" button.
Sub directories
If you have a lot of reports, it might be difficult to list them all in the "Reports" drop down. You can solve this by creating "sub directories" Kagura.js supports this as an extraOption. Here is an example:
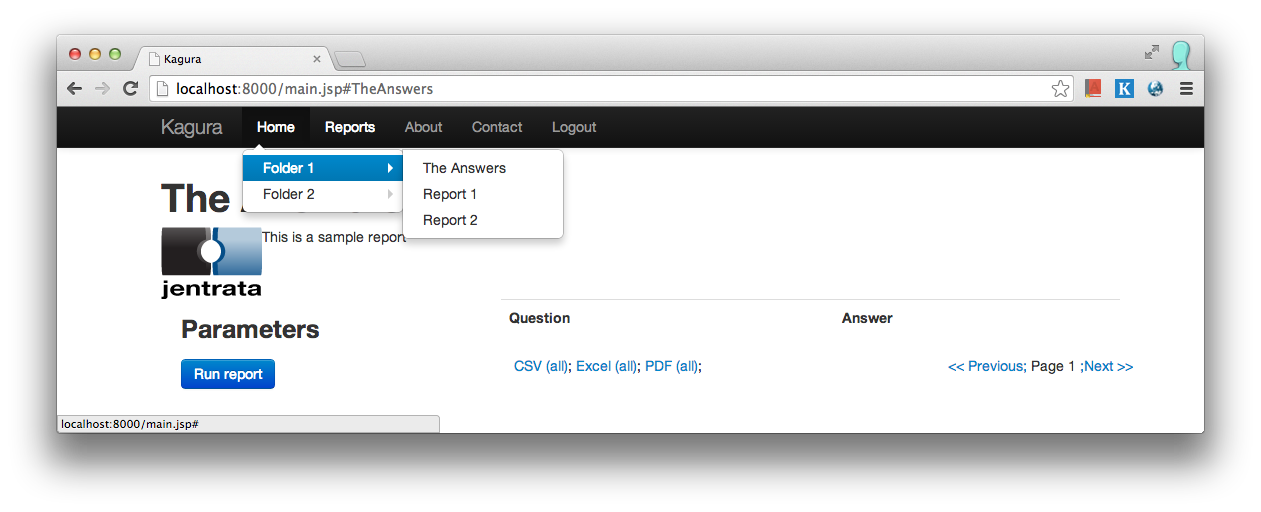
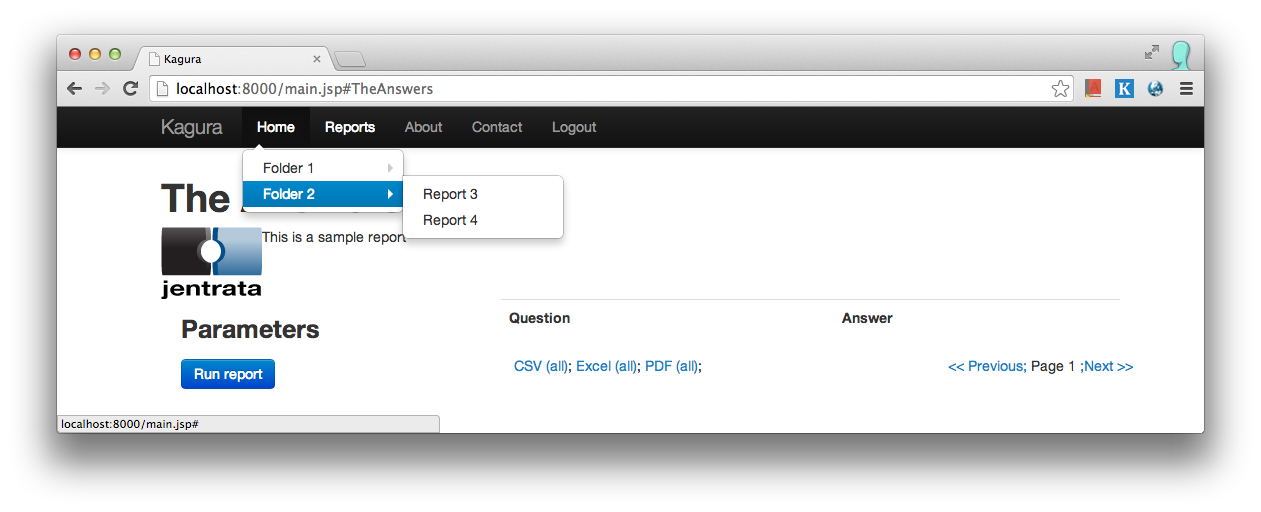
This was done by adding directory to the report:
extraOptions:
  reportName: "The Answers"
  directory: "Folder 1"
  description: "This is a sample report"
  image: "http://jentrata.org/images/jentrata.png"
I also created a number of fake reports:
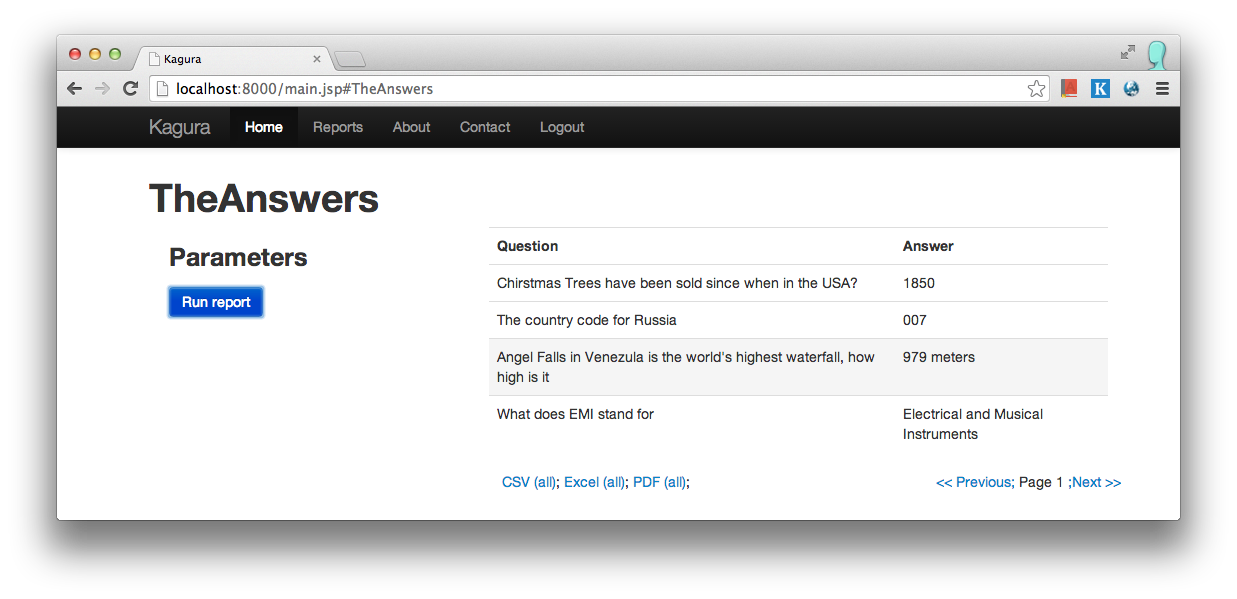
Filters / Parameters
At some point you may want to create a filter / parameter, so you can sort though the data easier.
It's fairly straightforward to add parameters, it comes in 2 stages:
- Adding the parameter as a user control
- Using the values in your report if they are populated
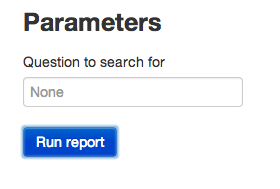
Adding a user control
paramConfig:
 - type: String
   id: questionQuery
   name: "Question to search for"
   help: "Leave blank for any"
   placeholder: "None"
Or in short
paramConfig:
- { type: String, id: questionQuery, name: "Question to search for", help: "Leave blank for any", placeholder: "None" }
This adds a simple text entry control:
However this does nothing at the moment, you need to connect it.
Using the value
To use the value there are several ways, the value insertion is done by Freemarker and it's associated plugins. Simply change the SQL line to this:
sql: "SELECT id, question, answer FROM Answers <@where><@clause render=param.questionQuery?has_content> question=${method.value(param.questionQuery)} </@clause></@where> <@limit />"
Or, if you don't want to use the custom Kagura freemarker tags, you can use:
sql: "SELECT id, question, answer FROM Answers <#if param.questionQuery?has_content> question=${method.value(param.questionQuery)} </#if> <@limit />"
As of version 1.3 you can now use list of values, for instance this will allow the user to select multiple of many items:
sql: "SELECT id, question, answer FROM Answers <@where><@clause render=param.questionQuery?has_content> question=${method.values(param.questionQuery)} </@clause></@where> <@limit />"
Where param.questionQuery is an array of values provided by the parameter type ManyCombo.
Just a quick note on the tags: (Assuming you know basic freemarker.)
| String | Meaning |
|---|---|
| param.* | All parameters are found here. Please note if you have a parameter without an ID but a name, it will automatically camelCase the name and use that as an ID. |
| <@where> | Will conditionally add WHERE depending on if there are any active <@clause> tags. So if you were to not select any value for "questionQuery" it would add the WHERE token on appropriately. <@where> is more powerful than this. See JNDI/JDBC Freemarker Report and Quick reference for more information and examples |
| <@caluse render=> | Acts like an IF statement. It takes a freemarker boolean expression and renders if text if the expression evaluates to true. This allows for you to appropriately apply parameters, it works with <@where> to correctly render arguments |
${method.value(...)} | Does a SQL safe (using prepareStatement) insert of a value into the query. |
${method.values(...)} | Does a SQL safe insert of multiple query values. |
More copy/paste recipes for parameters can be found in the Quick reference.
And tada:
Finally
Remember, the user needs to be setup with the Authentication Provider, or with the middleware you are using in order to see the reports.
The sample report is here is accessible in github at:
https://github.com/arranubels/kagura-custom-assembly/tree/basic_db_report_getting_started
Click the link for a detailed document on all the features of an JNDI/JDBC Freemarker Report.